
Publication: arXiv:1605.00711, accepted ApJ
The universe has a way of keeping scientists guessing. For over 70 years, scientists have been trying to understand the particle nature of dark matter. We’ve buried detectors deep underground to shield them from backgrounds, smashed particles together at inconceivably high energies, and dedicated instruments to observing where we have measured dark matter to be a dominant component. Like any good mystery, this has yielded more questions than answers.
There are a lot of ideas as to what the distribution of dark matter looks like in the universe. One example is from a paper by L. Pieri et al., (PRD 83 023518 (2011), arXiv:0908.0195). They simulated what the gamma-ray sky would look like from dark matter annihilation into b-quarks. The results of their simulation are shown below. The plot is an Aitoff projection in galactic coordinates (meaning that the center of the galaxy is at the center of the map).

The obvious bright spot is the galactic center. This is because the center of the Milky Way has the highest density of dark matter nearby (F. Iocco, Pato, Bertone, Nature Physics 11, 245–248 (2015)). Just for some context the center of the Milky way is ~8.5 kiloparsecs or 27,700 light years away from us… so it’s a big neighborhood. However, the center of the galaxy is particularly hard to observe because the Galaxy itself is obstructing our view. As it turns out there are lots of stars, gas and dust in our Galaxy 🙂
This map also shows us that there are other regions of high dark matter density away from the Galactic center. These could be dark matter halos, dwarf spheroidal galaxies, galaxy clusters, or anything else with a high density of dark matter. The paper I’m discussing uses this simulation in combination with the Fermi-LAT 3rd source catalog (3FGL) (Fermi-LAT Collaboration, Astrophys. J. Suppl 218 (2015) arXiv:1501.02003).
Over 1/3 of the sources in the 3FGL are unassociated with a known astrophysical source (this means we don’t know what source is yielding gamma rays). The paper analyzes these sources to see if their gamma-ray flux is consistent with dark matter annihilation or if it’s more consistent with the spectral shape from pulsars, rapidly rotating neutron stars with strong magnetic fields that emit radio waves (and gamma-rays) in very regular pulses. These are a fascinating class of astrophysical objects and I’d highly recommend reading up on them (See NASA’s site). The challenge is that the gamma-ray flux from dark matter annihilation into b-quarks is surprisingly similar to that from pulsars (See below).


They found 34 candidates sources which are consistent with both dark matter annihilation and pulsar spectra away from the Galactic plane using two different machine learning techniques. Generally, if a source can be explained by something other than dark matter, that’s the accepted interpretation. So, the currently favored astrophysical interpretations for these objects are pulsars. Yet, these objects could also be interpreted as dark matter annihilation taking place in ultra-faint dwarf galaxies or dark matter subhalos. Unfortunately, Fermi-LAT spectra are not sufficient to break degeneracies between the different scenarios. The distribution of the 34 dark matter subhalo candidates found in this work are shown below.
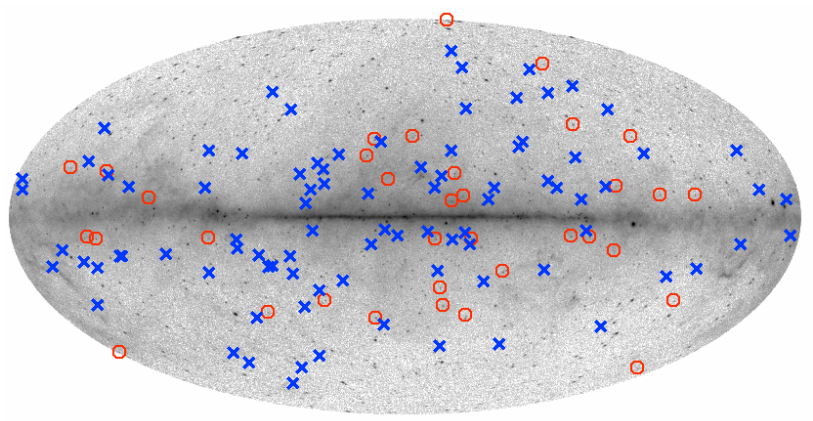
High-latitude 3FGL pulsars (blue crosses) are also plotted for comparison.
The paper presents scenarios which support the pulsar interpretation and with the dark matter interpretation. If they are pulsars, they find the 34 found to be in excellent agreement with predictions from a new population that predicts many more pulsars than are currently found. However, if they are dark matter substructures, they also place upper limits on the number of Galactic subhalos surviving today and on dark matter annihilation cross sections. The cross section is shown below.

The only thing we can do (beyond waiting for more Fermi-LAT data) is try to identify these sources definitely as pulsars which requires extensive follow-up observations using other telescopes (in particular radio telescopes to look for pulses). So stay tuned!
Other reading: See also Chris Karwin’s ParticleBite on the Fermi-LAT analysis.
Latest posts by Regina Caputo (see all)
- Dragonfly 44: A potential Dark Matter Galaxy - September 7, 2016
- Dark matter of Pulsars?? cont… - August 4, 2016
- Dark matter or Pulsars? - July 6, 2016