The title of this paper sounds like some standard astrophysics analyses; but, dig a little deeper and you’ll find – what I think – is an incredibly interesting, surprising and unexpected observation.
The Coma Cluster: NASA, ESA, and the Hubble Heritage Team (STScI/AURA)
Last year, using the WM Keck Observatory and the Gemini North Telescope in Manuakea, Hawaii, the Dragonfly Telephoto Array observed the Coma cluster (a large cluster of galaxies in the constellation Coma – I’ve included a Hubble Image to the left). The team identified a population of large, very low surface brightness (ie: not a lot of stars), spheroidal galaxies around an Ultra Diffuse Galaxy (UDG) called Dragonfly 44 (shown below). They determined that Dragonfly 44 has so few stars that gravity could not hold it together – so some other matter had to be involved – namely DARK MATTER (my favorite kind of unknown matter).
The ultra-diffuse galaxy Dragonfly 44. The galaxy consists almost entirely of dark matter. It is surrounded by faint, compact sources. Image credit: Pieter van Dokkum / Roberto Abraham / Gemini Observatory / SDSS / AURA
The team used the DEIMOS instrument installed on Keck II to measure the velocities of stars for 33.5 hours over a period of six nights so they could determine the galaxy’s mass. Observations of Dragonfly 44’s rotational speed suggest that it has a mass of about one trillion solar masses, about the same as the Milky Way. However, the galaxy emits only 1% of the light emitted by the Milky Way. In other words, the Milky Way has more than a hundred times more stars than Dragonfly 44. I’ve also included the Mass-to-Light ratio plot vs. the dynamical mass. This illustrates how unique Dragonfly 44 is compared to other dark matter dominated galaxies like dwarf spheroidal galaxies.
Relation between dynamical mass-to-light ratio and dynamical mass. Open symbols are dispersion-dominated objects from Zaritsky, Gonzalez, & Zabludoff (2006) and Wolf et al. (2010). The UDGs VCC 1287 (Beasley et al. 2016) and Dragonfly 44 fall outside of the band defined by the other galaxies, having a very high M/L ratio for their mass.
What is particularly exciting is that we don’t understand how galaxies like this form.
Their research indicates that these UDGs could be failed galaxies, with the sizes, dark matter content, and globular cluster systems of much more luminous objects. But we’ll need to discover more to fully understand them.
Further reading (works by the same authors)
Forty-Seven Milky Way-Sized, Extremely Diffuse Galaxies in the Coma Cluster,arXiv: 1410.8141
Spectroscopic Confirmation of the Existence of Large, Diffuse Galaxies in the Coma Cluster: arXiv: 1504.03320
Title: Estimating the GeV Emission of Millisecond Pulsars in Dwarf Spheroidal Galaxies Publication: arXiv: 1607.06390, submitted to ApJL
Howdy, particlebite enthusiasts! I’m blogging this week from ICHEP. Over the next week there will be a lot of exciting updates from the particle physics community… like what happened to that 750 GeV bump? are there any new bumps for us to be excited about? have we broken the standard model yet? But all these will come later in the week – today is registration. But in the mean time, there have been a lot of interesting papers circulating about disentangling dark matter from our favorite astrophysical background – pulsars.
The paper, which is the focus of this post, delves deeper into understanding potential gamma-ray emission found in dwarf spheroidal galaxies (dsphs) from pulsars. The density of millisecond pulsars (MSPs) is related to the density of stars in a cluster. In low-density stellar environments, such as dsphs, the abundance of MSPs is expected to be proportional to stellar mass (it’s much higher for globular cluster and the Galactic center). Remember, the advantage over dsphs in looking for a dark matter signal when compared with, for example, the Galactic center is that they have many fewer detectable gamma-ray emitting sources – like MSPs (see arXiv: 1503.02641 for a recent Fermi-LAT paper). However, as we get more and more sensitive, the probability of detecting gamma rays from astrophysical sources in dsphs goes up as well.
MSP gamma-ray luminosity function (0.1–100 GeV) normalized to the stellar mass of the Milky Way. The shaded gray band represents the 1σ statistical uncertainty on the broken power-law fit to these data and dashed gray lines represent the systematic uncertainty envelope.
This work estimates what the gamma-ray flux should be (known as the luminosity function) for MSPs found in dsphs. They assume that the number of MSPs is proportional to the stellar density and that the spectrum is similar to the 90 known MSPs in the Galactic disk (see the figure on the right). It fits the gamma-ray spectrum to a broken power law. We can then scale this result to the number of predicted MSPs in each dsph and distance of the dsph. This is then used as a prediction of the gamma-ray spectrum we would expect from MSPs coming from an individual dsph.
They found was that for the highest stellar mass dsphs (Fornax, Draco – usually the classical ones, for example), there is a modest MSP population. However, even for the largest classical dsph, Fornax, the predicted MSP flux > 500 MeV is~ 10−12 ph cm−2s−1 , which is about an order of magnitude below the typical flux upper limits obtained at high Galactic latitudes after six years of the LAT survey, ∼ 10−10 ph cm−2s−1 (see arXiv: 1503.02641 again). The predicted flux and sensitivity is shown below.
Expected flux versus J-factor (remember J-factor scales with distance). Blue points indicate the predicted MSP contribution in 30 Milky Way dsphs and dsph candidates. The gray shaded band represents the sensitivity for 6 years of the LAT data. The red curve represents a DM annihilation model that is consistent with both DM interpretations of the Galactic Center Excess and the characteristic spectral shape of MSPs.
So all in all, this is good news for dsphs as dark matter targets. Understanding the backgrounds is imperative for having confidence in an analysis if a signal is found, and this gives us more confidence that we understand one of the dominant backgrounds in the hunt for dark matter.
Title: 3FGL Demographics Outside the Galactic Plane using Supervised Machine Learning: Pulsar and Dark Matter Subhalo Interpretations Publication: arXiv:1605.00711, accepted ApJ
The universe has a way of keeping scientists guessing. For over 70 years, scientists have been trying to understand the particle nature of dark matter. We’ve buried detectors deep underground to shield them from backgrounds, smashed particles together at inconceivably high energies, and dedicated instruments to observing where we have measured dark matter to be a dominant component. Like any good mystery, this has yielded more questions than answers.
There are a lot of ideas as to what the distribution of dark matter looks like in the universe. One example is from a paper by L. Pieri et al., (PRD 83 023518 (2011), arXiv:0908.0195). They simulated what the gamma-ray sky would look like from dark matter annihilation into b-quarks. The results of their simulation are shown below. The plot is an Aitoff projection in galactic coordinates (meaning that the center of the galaxy is at the center of the map).
Gamma-ray sky map from dark matter annihilation into bb using the Via Lacita simulation between 3-40 GeV. L. Pieri et al., (PRD 83 023518 (2011), arXiv:0908.0195)
The obvious bright spot is the galactic center. This is because the center of the Milky Way has the highest density of dark matter nearby (F. Iocco, Pato, Bertone, Nature Physics 11, 245–248 (2015)). Just for some context the center of the Milky way is ~8.5 kiloparsecs or 27,700 light years away from us… so it’s a big neighborhood. However, the center of the galaxy is particularly hard to observe because the Galaxy itself is obstructing our view. As it turns out there are lots of stars, gas and dust in our Galaxy 🙂
This map also shows us that there are other regions of high dark matter density away from the Galactic center. These could be dark matter halos, dwarf spheroidal galaxies, galaxy clusters, or anything else with a high density of dark matter. The paper I’m discussing uses this simulation in combination with the Fermi-LAT 3rd source catalog (3FGL) (Fermi-LAT Collaboration, Astrophys. J. Suppl 218 (2015) arXiv:1501.02003).
Over 1/3 of the sources in the 3FGL are unassociated with a known astrophysical source (this means we don’t know what source is yielding gamma rays). The paper analyzes these sources to see if their gamma-ray flux is consistent with dark matter annihilation or if it’s more consistent with the spectral shape from pulsars, rapidly rotating neutron stars with strong magnetic fields that emit radio waves (and gamma-rays) in very regular pulses. These are a fascinating class of astrophysical objects and I’d highly recommend reading up on them (See NASA’s site). The challenge is that the gamma-ray flux from dark matter annihilation into b-quarks is surprisingly similar to that from pulsars (See below).
Gamma-ray spectra of dark matter annihilating into b-quarks and taus. (Image produced by me using DMFit)Gamma-ray spectrum from pulsars from the globular cluster 47 Tuc (Fermi-LAT Collaboration)
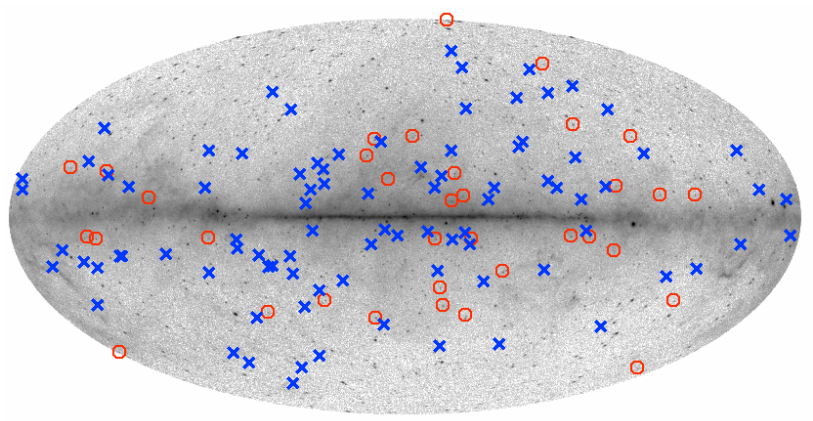
They found 34 candidates sources which are consistent with both dark matter annihilation and pulsar spectra away from the Galactic plane using two different machine learning techniques. Generally, if a source can be explained by something other than dark matter, that’s the accepted interpretation. So, the currently favored astrophysical interpretations for these objects are pulsars. Yet, these objects could also be interpreted as dark matter annihilation taking place in ultra-faint dwarf galaxies or dark matter subhalos. Unfortunately, Fermi-LAT spectra are not sufficient to break degeneracies between the different scenarios. The distribution of the 34 dark matter subhalo candidates found in this work are shown below.
Galactic distribution of 34 high-latitude Galactic candidates (red circles) superimposed on a smoothed Fermi LAT all-sky map for energies E ≥ 1 GeV based on events collected during the period 2008 August 4–2015 August 4 (Credit: Fermi LAT Collaboration). High-latitude 3FGL pulsars (blue crosses) are also plotted for comparison.
The paper presents scenarios which support the pulsar interpretation and with the dark matter interpretation. If they are pulsars, they find the 34 found to be in excellent agreement with predictions from a new population that predicts many more pulsars than are currently found. However, if they are dark matter substructures, they also place upper limits on the number of Galactic subhalos surviving today and on dark matter annihilation cross sections. The cross section is shown below.
Upper limits on the dark matter annihilation cross section for the b-quark channel using the 14 subhalo candidates very far from the galactic plane (>20 degrees) (black solid line). The dashed red line is an upper limit derived from the Via Lactea II simulation when zero 3FGL subhalos are adopted (Schoonenberg et al. 2016). The blue line corresponds to the constraint for zero 3FGL subhalo candidates using the Aquarius simulation instead (Bertoni, Hooper, & Linden 2015). The horizontal dotted line marks the canonical thermal relic cross section (Steigman, Dasgupta, & Beacom 2012).
The only thing we can do (beyond waiting for more Fermi-LAT data) is try to identify these sources definitely as pulsars which requires extensive follow-up observations using other telescopes (in particular radio telescopes to look for pulses). So stay tuned!
This is part 2 in my “series” on dark matter in dwarf galaxies. In my previous post, I explained a bit about WIMP-like dark matter and why we look for its signature in these particular type of small galaxies (dsphs) that are orbiting the Milky Way. About 2 months ago, the Dark Energy Survey (DES) collaboration released its first year of data to the public. Similar to SDSS, DES is also a surveying the optical-near infrared sky using the 4 m Victor M. Blanco Telescope at Cerro Tololo Inter-American Observatory in Chile. The important distinction between SDSS and DES is that while SDSS observes the northern galactic latitudes, DES observes southern galactic latitudes. Since this is a whole new region of observation, we expect a lot of new exciting things to come out of the data… And sure enough exciting things came. Eight new dsphs candidates were discovered and published in the first data release orbiting. Dwarf galaxies are very old (> 13 billion years old) and have little gas, dust and star formation. I say candidates, because to confirm that these dsph candidates not something else, follow-up observations with other telescopes have to be done.
However, that doesn’t mean that we (we being everyone since the Fermi data is public) can’t have a look at these potential dark matter targets. On the same day that the new DES candidate dsphs were released, the Fermi-LAT team had a look. Of the eight candidates, most were far away (~100 kpc or ~300k light years). This distance makes looking for dark matter difficult because a signal will be very weak. However, there was one candidate that was only 32 kpc away (DES J0335.6-5403 or Reticulum II), making it the most interesting search target. You can see the counts map of Reticulum II on the right.
The results (on the left) showed that there was no clear WIMP-like dark matter signature coming from any of the candidates (shucks!!). However, the closest target wasn’t totally boring. Another team found a small excess (~2 sigma) in Reticulum II. When the Fermi-LAT team compared analysis methods, we found that there results were optimistic, yet not inconsistent with ours. This got the New York Times’s writer Dennis Overbye excited :).
The good news is that DES is going to continue for at least 4 more years, which means we’ll have many more opportunities to search for dark matter in dsphs. What we need to find is nearby dsphs. And even more exciting, the Large Synoptic Survey Telescope (LSST) will start taking in the 2020s. This telescope will have access to ~half of the sky (more on the LSST in a future post ;)). This will give us many more targets in the years to come, so stay tuned!
Last week there were some exciting new results from the Fermi-LAT collaboration in dark matter searches! Dark matter is an exciting topic – we believe that 85% of the known matter in the universe is stuff that we can’t see. “Dark matter” itself is a very broad idea. I’ll need to start by making some assumptions on the kind of dark matter we’re looking for. We assume a dark matter candidate exists as a particle that is both massive and interacts on the scale of the “weak” force (specifically a Weakly Interacting Massive Particle – WIMP). There are lots of reasons that motivate this type of a candidate (cosmic microwave background, baryon acoustic oscillations, large scale structure, gravitational lensing, and galactic rotation curves to name a few), and I can elaborate more in another post if readers are interested. For now, just trust me when I say WIMPs are a well motivated dark matter candidate.
Based on things like galactic rotation curves we can guess the distribution of dark matter in our galaxy – and the highest concentration is in the very center. The problem with looking for dark matter in the center of the galaxy is that there are lots of backgrounds. First, there are ~8 kilo-parsecs worth of spiral arms in between us and the center. That’s a lot of stuff to try to understand. Plus there is a super massive black hole – Sagittarius A* – and an unknown number of pulsars (for example) also in the region of the galactic center. Other good, less chaotic, places to search for WIMPs are small, old satellite galaxies orbiting the Milky Way. One class of these types of galaxies is called dwarf spheroidal galaxies (dsphs) (not to be confused with Disney-type dwarfs). They don’t have enough visible matter to be gravitationally bound (even though they are!), so we know that there must be a high concentration of dark matter in these systems. Below is a picture of the location of some known dsphs. In total about 25 are known that Fermi-LAT will analyze. (you can see Flip’s post for more info too!)
Many of these dsphs were discovered by the Sloan Digital Sky Survey (SDSS). SDSS is a 2.5 m optical telescope located at Apache Point Observatory in New Mexico. It has been surveying the northern sky since 2000. The Fermi-LAT collaboration then points at the location of these dsphs and looks for gamma-rays (high energy photons) which would indicate dark matter annihilation. Since these are old systems, there shouldn’t be any gamma-ray emission from these targets that isn’t from dark matter.
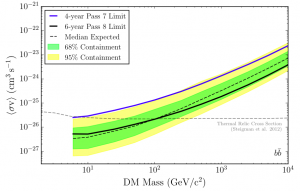
The Fermi-LAT collaboration has submitted the newest searches for these known dsphs in a paper on arXiv on March 9th. They used 6 years of data and the newest, best event analysis and reconstruction (called Pass 8). The results are on the left: the y-axis shows the cross section times the thermally averaged velocity that we are sensitive to and the x-axis shows different dark matter masses. The blue line shows the previous results obtained by Fermi-LAT. The dashed black line shows what we would expect to see given a specific model of dark matter. In this case we assume that the dark matter decays into b-quarks and anti-b quarks and then from then gamma rays are produced. The solid black line shows the limit of what we actually observed. (Unfortunately no discovery!! That would look like a sharp divergence from the expectation).
Although we haven’t found an indication of dark matter annihilation, we are just becoming sensitive to the “thermal relic” (or the amount of dark matter expected after the big bang shown in the dashed gray line ). So the next few years of these searches are going to be very exciting. I’ll also hint at a future post… there is currently another collaboration (the Dark Energy Survey, or DES), which similarly to SDSS will find more dsphs for us to use as targets – which will only improve our sensitivity. In the next post I’ll talk about these results.
I hope you’ve enjoyed this post! Please post any questions/comments.
This is my first post as a new contributor to Particlebites. Here’s a little bite about me: I’m an experimental particle physicist working at the University of Mainz in Germany as a postdoctoral researcher. I work on the ATLAS experiment at CERN and have for the past 6 years or so. (I’ll fill out my bio soon). This has been a really exciting time to be a particle physicist! Only a year ago the Higgs was discovered at the LHC, and just a few weeks ago Francois Englert and Peter Higgs won the Nobel prize for their work predicting it’s existence almost 50 years ago. These results are exciting further strengthen the Standard Model.
However, my post today is regarding brand new results hot off the press from the Large Underground Xenon (LUX) experiment. The purpose of LUX is to search for WIMP-like dark matter. After 85 days of running, they achieved the world’s highest sensitivity. Unfortunately they didn’t find any excess signal – which also means that the earlier CDMS-Si potential signal is also ruled out. But the potential for discovery is really exciting. The next run will be over 300 days and should further increase the sensitivity by ~5x depending on the cross section. Dark matter is out there… it’s just really good at hiding.
Everyone should check out their paper: http://luxdarkmatter.org/papers/LUX_First_Results_2013.pdf
And attached is a picture of their exclusion plot (unfortunately they didn’t include a legend on this version – it’s described in the caption in the paper and I’ve included it here).
The LUX 90% confidence limit on the spin- independent elastic WIMP-nucleon cross section (blue), together with the ±1σ variation from repeated trials, where trials fluctuating below the expected number of events for zero BG are forced to 2.3 (blue shaded). We also show Edelweiss II (dark yellow line), CDMS II (green line), ZEPLIN-III (magenta line) and XENON100 100 live- day (orange line), and 225 live-day (red line) results. The inset (same axis units) also shows the regions measured from annual modulation in CoGeNT (light red, shaded), along with exclusion limits from low threshold re-analysis of CDMS II data (upper green line), 95% allowed region from CDMS II silicon detectors (green shaded) and centroid (green x), 90% allowed region from CRESST II (yellow shaded) and DAMA/LIBRA allowed region interpreted by (grey shaded).
Happy reading! And I hope you enjoy my future posts.


 The Fermi-LAT collaboration has submitted the newest searches for these known dsphs in a paper on