This is part two of our coverage of the CDF W mass measurement, discussing how the measurement was done. Read about the implications of this result in our sister post here
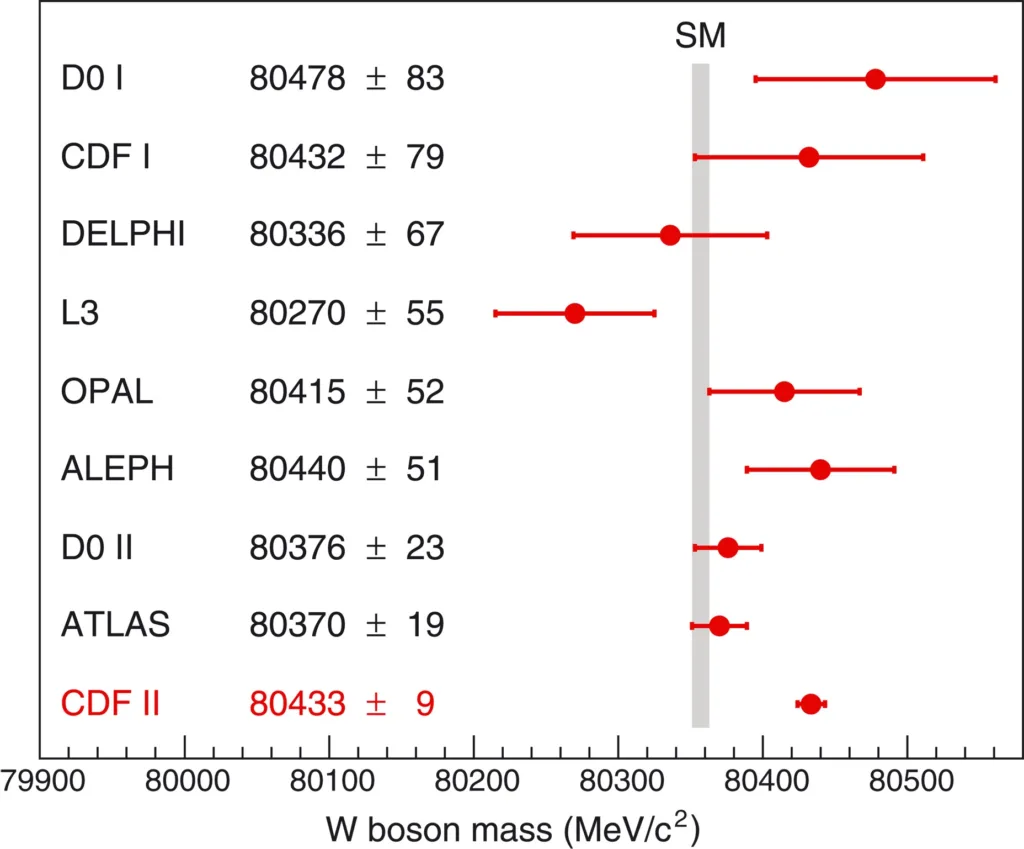
Last week, the CDF collaboration announced the most precise measurement of the W boson’s mass to date. After nearly ten years of careful analysis, the W weighed in at 80,433.5 ± 9.4 MeV: a whopping seven standard deviations away from the Standard Model expectation! This result quickly became the talk of the town among particle physicists, and there are already dozens of arXiv papers speculating about what it means for the Standard Model. One of the most impressive and hotly debated aspects of this measurement is its high precision, which came from an extremely careful characterization of the CDF detector and recent theoretical developments in modeling proton structure. In this post, I’ll describe how they made the measurement and the clever techniques they used to push down the uncertainties.

The imaginatively titled “Collider Detector at Fermilab” (CDF) collected proton-antiproton collision data at Fermilab’s Tevatron accelerator for over 20 years, until the Tevatron shut down in 2011. Much like ATLAS and CMS, CDF is made of cylindrical detector layers, with the innermost charged particle tracker and adjacent electromagnetic calorimeter (ECAL) being most important for the W mass measurement. The Tevatron ran at a center of mass energy of 1.96 TeV — much lower than the LHC’s 13 TeV — which enabled a large reduction in the “theoretical uncertainties” on the measurement. Physicists use models called “parton distribution functions” (PDFs) to calculate how a proton’s momentum is distributed among its constituent quarks, and modern PDFs make very good predictions at the Tevatron’s energy scale. Additionally, W boson production in proton-antiproton collisions doesn’t involve any gluons, which are a major source of uncertainty in PDFs (LHC collisions are full of gluons, making for larger theory uncertainty in LHC W mass measurements).

Armed with their fancy PDFs, physicists set out to measure the W mass in the same way as always: by looking at its decay products! They focused on the leptonic channel, where the W decays to a lepton (electron or muon) and its associated neutrino. This clean final state is easy to identify in the detector and allows for a high-purity, low-background signal selection. The only sticking point is the neutrino, which flies out of the detector completely undetected. Thankfully, momentum conservation allowed them to reconstruct the neutrino’s transverse momentum (pT) from the rest of the visible particles produced in the collision. Combining this with the lepton’s measured momentum, they reconstructed the “transverse mass” of the W — an important observable for estimating its true mass.

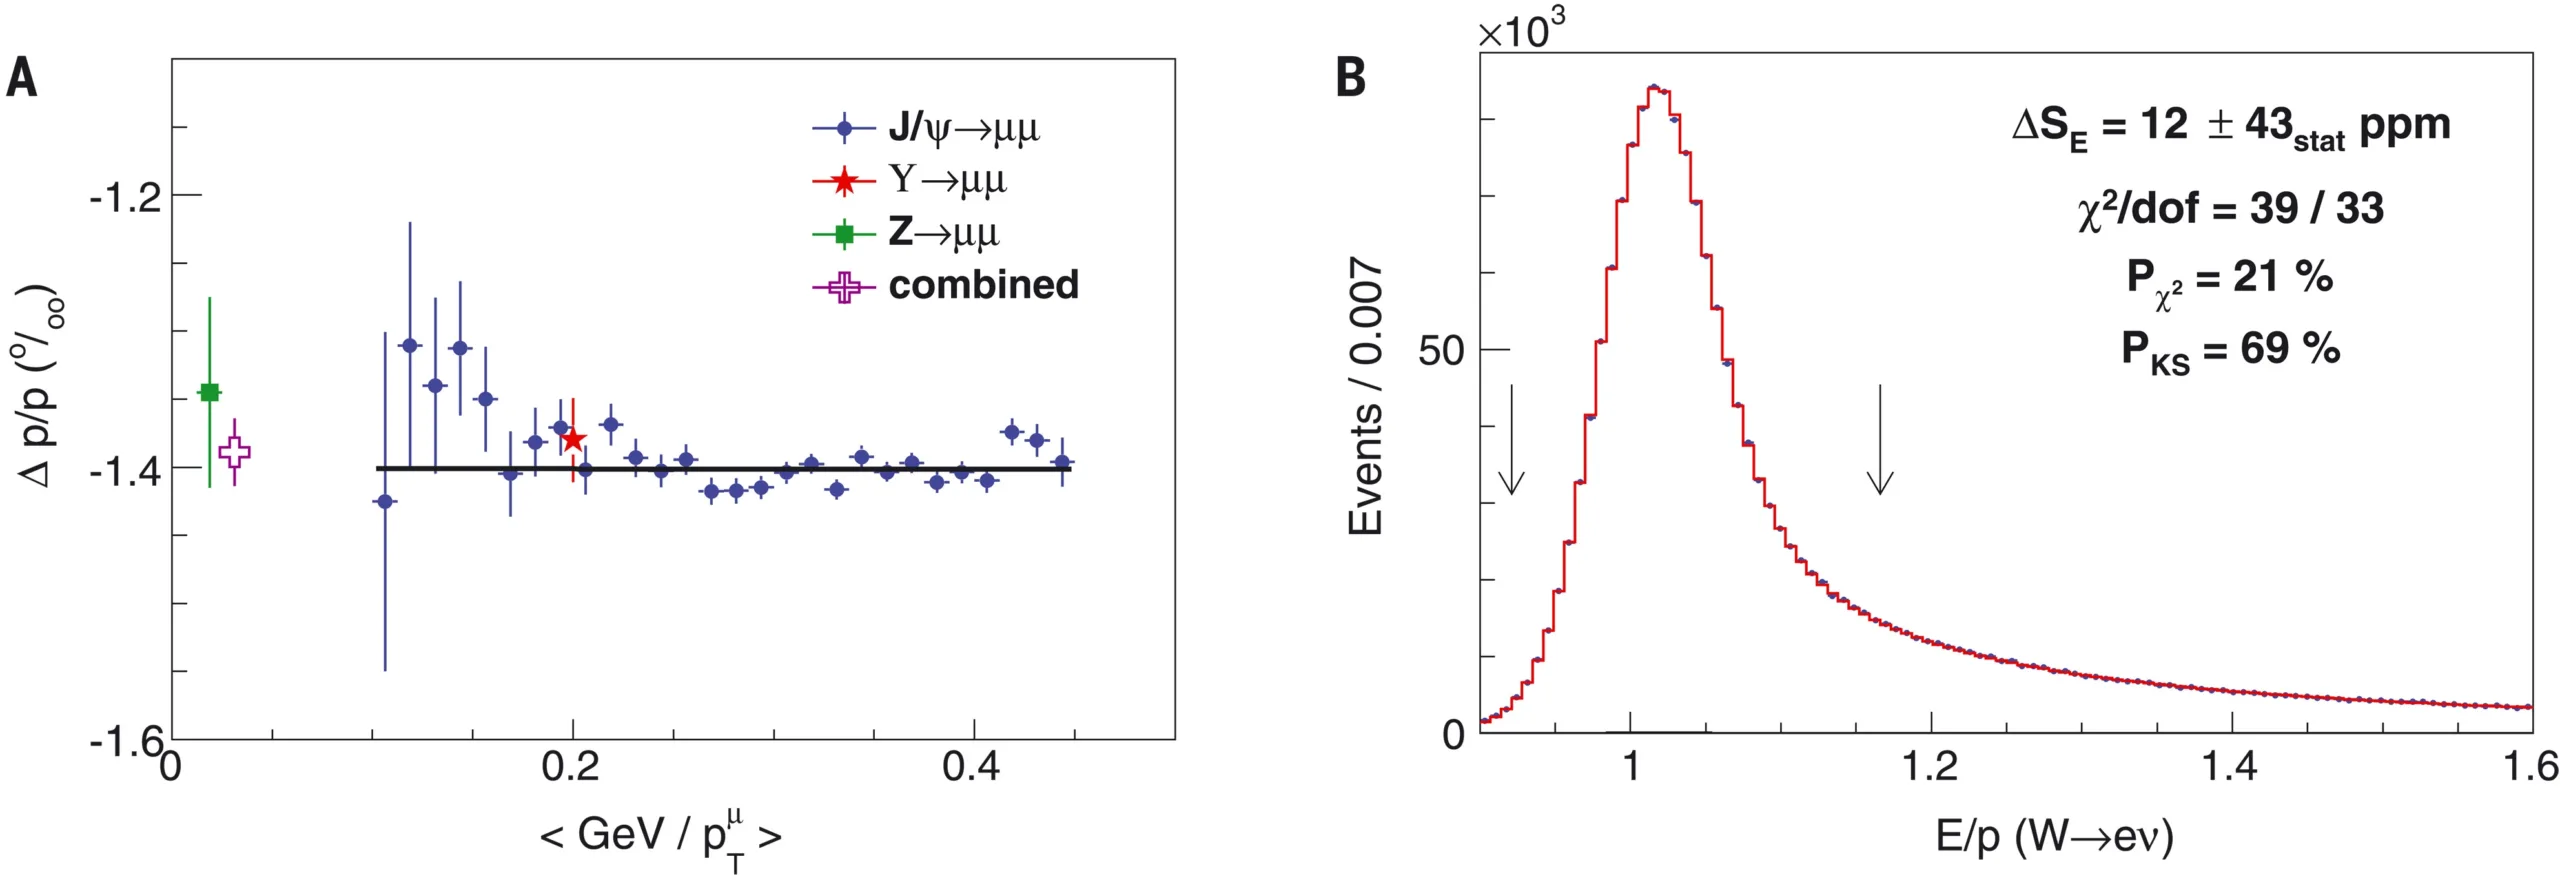
Many of the key observables for this measurement flow from the lepton’s momentum, which means it needs to be measured very carefully! The analysis team calibrated their energy and momentum measurements by using the decays of other Standard Model particles: the ϒ(1S) and J/ψ mesons, and the Z boson. These particles’ masses are very precisely known from other experiments, and constraints from these measurements helped physicists understand how accurately CDF reconstructs a particle’s energy. For momentum measurements in the tracker, they reconstructed the ϒ(1S) and J/ψ masses from their decays to muon-antimuon pairs inside CDF, and compared CDF-measured masses to their known values from other experiments. This allowed them to calculate a correction factor to apply to track momenta. For ECAL energy measurements, they looked at samples of Z and W bosons decaying to electrons, and measured ratio of energy deposited in the ECAL (E) to the momentum measured in the tracker (p). The shape of the E/p distribution then allowed them to calculate an energy calibration for the ECAL.

To make sure their tracker and ECAL calibrations worked correctly, they applied them in measurements of the Z boson mass in the electron and muon decay channels. Thankfully, their measurements were consistent with the world average in both channels, providing an important cross-check of their calibration strategy.
Having done everything humanly possible to minimize uncertainties and calibrate their measurements, the analysis team was finally ready to measure the W mass. To do this, they simulated W boson events with many different settings for the W mass (an additional mountain of effort went into ensuring that the simulations were as accurate as possible!). At each mass setting, they extracted “template” distributions of the lepton pT, neutrino pT, and W boson transverse mass, and fit each template to the distribution measured in real CDF data. The templates that best fit the measured data correspond to CDF’s measured value of the W mass (plus some additional legwork to calculate uncertainties)

After years of careful analysis, CDF’s measurement of mW = 80,433.5 ± 9.4 MeV sticks out like a sore thumb. If it stands up to the close scrutiny of the particle physics community, it’s further evidence that something new and mysterious lies beyond the Standard Model. The only way to know for sure is to make additional measurements, but in the meantime we’ll all be happily puzzling over what this might mean.

Read More
Quanta Magazine’s coverage of the measurement
A recorded talk from the Fermilab Wine & Cheese seminar covering the result in great detail
Latest posts by Sam Bright-Thonney (see all)
- A Massive W for CDF - April 14, 2022
- The Higgs Comes Out of its Shell - February 18, 2022
