The Fermi LAT Data Depicting Dark Matter Detection

The center of the galaxy is brighter than astrophysicists expected. Could this be the result of the self-annihilation of dark matter? Chris Karwin, a graduate student from the University of California, Irvine presents the Fermi collaboration’s analysis.

Editor’s note: this is a guest post by one of the students involved in the published result.

Presenting: Fermi-LAT Observations of High-Energy Gamma-Ray Emission Toward the Galactic Center
Authors: The Fermi-LAT Collaboration (ParticleBites blogger is a co-author)
Reference: 1511.02938Astrophys.J. 819 (2016) no.1, 44
Artist rendition of the Fermi Gamma-ray Space telescope in orbit. Image: http://fermi.gsfc.nasa.gov
Artist rendition of the Fermi Gamma-ray Space telescope in orbit. Image from NASA.

Introduction

Like other telescopes, the Fermi Gamma-Ray Space Telescope is a satellite that scans the sky collecting light. Unlike many telescopes, it searches for very high energy light: gamma-rays. The satellite’s main component is the Large Area Telescope (LAT). When this detector is hit with a high-energy gamma-ray, it measures the the energy and the direction in the sky from where it originated. The data provided by the LAT is an all-sky photon counts map:

The Fermi-LAT provides an all-sky counts map of gamma-rays. The color scale correspond to the number of detected photons. Image: http://svs.gsfc.nasa.gov/cgi-bin/details.cgi?aid=10887
All-sky counts map of gamma-rays. The color scale correspond to the number of detected photons. Image from NASA.

In 2009, researchers noticed that there appeared to be an excess of gamma-rays coming from the galactic center. This excess is found by making a model of the known astrophysical gamma-ray sources and then comparing it to the data.

What makes the excess so interesting is that its features seem consistent with predictions from models of dark matter annihilation. Dark matter theory and simulations predict:

  1. The distribution of dark matter in space. The gamma rays coming from dark matter annihilation should follow this distribution, or spatial morphology.
  2. The particles to which dark matter directly annihilates. This gives a prediction for the expected energy spectrum of the gamma-rays.

Although a dark matter interpretation of the excess is a very exciting scenario that would tell us new things about particle physics, there are also other possible astrophysical explanations. For example, many physicists argue that the excess may be due to an unresolved population of milli-second pulsars. Another possible explanation is that it is simply due to the mis-modeling of the background. Regardless of the physical interpretation, the primary objective of the Fermi analysis is to characterize the excess.

The main systematic uncertainty of the experiment is our limited understanding of the backgrounds: the gamma rays produced by known astrophysical sources. In order to include this uncertainty in the analysis, four different background models are constructed. Although these models are methodically chosen so as to account for our lack of understanding, it should be noted that they do not necessarily span the entire range of possible error. For each of the background models, a gamma-ray excess is found. With the objective of characterizing the excess, additional components are then added to the model. Among the different components tested, it is found that the fit is most improved when dark matter is added. This is an indication that the signal may be coming from dark matter annihilation.

Analysis

This analysis is interested in the gamma rays coming from the galactic center. However, when looking towards the galactic center the telescope detects all of the gamma-rays coming from both the foreground and the background. The main challenge is to accurately model the gamma-rays coming from known astrophysical sources.

Schematic of the experiment. We are interested in gamma-rays coming from the galactic center, represented by the red circle. However, the LAT detects all of the gamma-rays coming from the foreground and background, represented by the blue region. The main challenge is to accurately model the gamma-rays coming from known astrophysical sources. Image: http://www.universetoday.com/106062/what-is-the-milky-way-2/
Schematic of the experiment. We are interested in gamma-rays coming from the galactic center, represented by the red circle. However, the LAT detects all of the gamma-rays coming from the foreground and background, represented by the blue region. The main challenge is to accurately model the gamma-rays coming from known astrophysical sources. Image adapted from Universe Today.

An overview of the analysis chain is as follows. The model of the observed region comes from performing a likelihood fit of the parameters for the known astrophysical sources. A likelihood fit is a statistical procedure that calculates the probability of observing the data given a set of parameters. In general there are two types of sources:

  1. Point sources such as known pulsars
  2. Diffuse sources due to the interaction of cosmic rays with the interstellar gas and radiation field

Parameters for these two types of sources are fit at the same time. One of the main uncertainties in the background is the cosmic ray source distribution. This is the number of cosmic ray sources as a function of distance from the center of the galaxy. It is believed that cosmic rays come from supernovae. However, the source distribution of supernova remnants is not well determined. Therefore, other tracers must be used. In this context a tracer refers to a measurement that can be made to infer the distribution of supernova remnants. This analysis uses both the distribution of OB stars and the distribution of pulsars as tracers. The former refers to OB associations, which are regions of O-type and B-type stars. These hot massive stars are progenitors of supernovae. In contrast to these progenitors, the distribution of pulsars is also used since pulsars are the end state of supernovae. These two extremes serve to encompass the uncertainty in the cosmic ray source distribution, although, as mentioned earlier, this uncertainty is by no means bracketing. Two of the four background model variants come from these distributions.

An overview of the analysis chain. In general there are two types of sources: point sources and diffuse source. The diffuse sources are due to the interaction of cosmic rays with interstellar gas and radiation fields. Spectral parameters for the diffuse sources are fit concurrently with the point sources using a likelihood fit. The question mark represents the possibility of an additional component possibly missing from the model, such as dark matter.

The information pertaining to the cosmic rays, gas, and radiation fields is input into a propagation code called GALPROP. This produces an all-sky gamma-ray intensity map for each of the physical processes that produce gamma-rays. These processes include the production of neutral pions due to the interaction of cosmic ray protons with the interstellar gas, which quickly decay into gamma-rays, cosmic ray electrons up-scattering low-energy photons of the radiation field via inverse Compton, and cosmic ray electrons interacting with the gas producing gamma-rays via Bremsstrahlung radiation.

Residual map for one of the background models. Image: http://arxiv.org/abs/1511.02938
Residual map for one of the background models. Image from 1511.02938

The maps of all the processes are then tuned to the data. In general, tuning is a procedure by which the background models are optimized for the particular data set being used. This is done using a likelihood analysis. There are two different tuning procedures used for this analysis. One tunes the normalization of the maps, and the other tunes both the normalization and the extra degrees of freedom related to the gas emission interior to the solar circle. These two tuning procedures, performed for the the two cosmic ray source models, make up the four different background models.

Point source models are then determined for each background model, and the spectral parameters for both diffuse sources and point sources are simultaneously fit using a likelihood analysis.

Results and Conclusion

Best fit dark matter spectra for the four different background models. Image: 1511.02938

In the plot of the best fit dark matter spectra for the four background models, the hatching of each curve corresponds to the statistical uncertainty of the fit. The systematic uncertainty can be interpreted as the region enclosed by the four curves. Results from other analyses of the galactic center are overlaid on the plot. This result shows that the galactic center analysis performed by the Fermi collaboration allows a broad range of possible dark matter spectra.

The Fermi analysis has shown that within systematic uncertainties a gamma-ray excess coming from the galactic center is detected. In order to try to explain this excess additional components were added to the model. Among the additional components tested it was found that the fit is most improved with that addition of a dark matter component. However, this does not establish that a dark matter signal has been detected. There is still a good chance that the excess can be due to something else, such as an unresolved population of millisecond pulsars or mis-modeling of the background. Further work must be done to better understand the background and better characterize the excess. Nevertheless, it remains an exciting prospect that the gamma-ray excess could be a signal of dark matter.


Background reading on dark matter and indirect detection:

Can’t Stop Won’t Stop: The Continuing Search for SUSY

Title: “Search for top squarks in final states with one isolated lepton, jets, and missing transverse momentum in √s = 13 TeV pp collisions with the ATLAS detector”
Author: The ATLAS Collaboration
Publication: Submitted 13 June 2016, arXiv 1606.03903

Things at the LHC are going great. Run II of the Large Hadron Collider is well underway, delivering higher energies and more luminosity than ever before. ATLAS and CMS also have an exciting lead to chase down– the diphoton excess that was first announced in December 2015. So what does lots of new data and a mysterious new excess have in common? They mean that we might finally get a hint at the elusive theory that keeps refusing our invitations to show up: supersymmetry.

Feynman diagram of stop decay from proton-proton collisions.
Figure 1: Feynman diagram of stop decay from proton-proton collisions.

People like supersymmetry because it fixes a host of things in the Standard Model. But most notably, it generates an extra Feynman diagram that cancels the quadratic divergence of the Higgs mass due to the top quark contribution. This extra diagram comes from the stop quark. So a natural SUSY solution would have a light stop mass, ideally somewhere close to the top mass of 175 GeV. This expected low mass due to “naturalness” makes the stop a great place to start looking for SUSY. But according to the newest results from the ATLAS Collaboration, we’re not going to be so lucky.

Using the full 2015 dataset (about 3.2 fb-1), ATLAS conducted a search for pair-produced stops, each decaying to a top quark and a neutralino, in this case playing the role of the lightest supersymmetric particle. The top then decays as tops do, to a W boson and a b quark. The W usually can do what it wants, but in this case the group chose to select for one W decaying leptonically and one decaying to jets (leptons are easier to reconstruct, but have a lower branching ratio from the W, so it’s a trade off.) This whole process is shown in Figure 1. So that gives a lepton from one W, jets from the others, and missing energy from the neutrino for a complete final state.

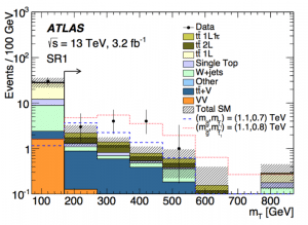
Transverse mass distribution in one of the signal regions.
Figure 2: Transverse mass distribution in one of the signal regions.

The paper does report an excess in the data, with a significance around 2.3 sigma. In Figure 2, you can see this excess overlaid with all the known background predictions, and two possible signal models for various gluino and stop masses. This signal in the 700-800 GeV mass range is right around the current limit for the stop, so it’s not entirely inconsistent. While these sorts of excesses come and go a lot in particle physics, it’s certainly an exciting reason to keep looking.

Figure 3 shows our status with the stop and neutralino, using 8 TeV data. All the shaded regions here are mass points for the stop and neutralino that physicists have excluded at 95% confidence. So where do we go from here? You can see a sliver of white space on this plot that hasn’t been excluded yet— that part is tough to probe because the mass splitting is so small, the neutralino emerges almost at rest, making it very hard to notice. It would be great to check out that parameter space, and there’s an effort underway to do just that. But at the end of the day, only more time (and more data) can tell.

(P.S. This paper also reports a gluino search—too much to cover in one post, but check it out if you’re interested!)

Limit curves for stop and neutralino masses, with 8 TeV ATLAS dataset.
Figure 3: Limit curves for stop and neutralino masses, with 8 TeV ATLAS dataset.

References & Further Reading

  1. “Supersymmetry, Part I (Theory), PDG Review
  2. “Supersymmetry, Part II (Experiment), PDG Review
  3. ATLAS Supersymmetry Public Results Twiki
  4. “Opening up the compressed region of stop searches at 13 TeV LHC”, arXiv hep-ph 1506.00653


Respecting your “Elders”

Theoretical physicists have designed a new way to explain the how dark matter interactions can explain the observed amount of dark matter in the universe today. This elastically decoupling dark matter framework, is a hybrid of conventional and novel dark matter models.

Presenting: Elastically Decoupling Dark Matter
Authors: Eric Kuflik, Maxim Perelstein, Nicolas Rey-Le Lorier, Yu-Dai Tsai
Reference: 1512.04545, Phys. Rev. Lett. 116, 221302 (2016)

The particle identity of dark matter is one of the biggest open questions in physics. The simplest and most widely assumed explanation is that dark matter is a weakly-interacting massive particle (WIMP). Assuming that dark matter starts out in thermal equilibrium in the hot plasma of the early universe, the present cosmic abundance of WIMPs is set by the balance of two effects:

  1. When two WIMPs find each other, they can annihilate into ordinary matter. This depletes the number of WIMPs in the universe.
  2. The universe is expanding, making it harder for WIMPs to find each other.

This process of “thermal freeze out” leads to an abundance of WIMPs controlled by the dark matter mass and interaction strength. The term ‘weakly-interacting massive particle’ comes from the observation that dark matter of roughly the mass of the weak force particle that interact through the weak nuclear force gives the experimentally measured dark matter density today.

Two ways for a new particle, X, to produce the observed dark matter abundance: (left) conventional WIMP annihilation into Standard Model (SM) particles versus (right) strongly-Interacting 3-to-2 interactions that reduce the amount of dark matter.
Two ways for a new particle, X, to produce the observed dark matter abundance: (left) WIMP annihilation into Standard Model (SM) particles versus (right) SIMP 3-to-2 interactions that reduce the amount of dark matter.

More recently, physicists noticed that dark matter with very large interactions with itself (not ordinary matter), can produce the correct dark matter density in another way. These “strongly interacting massive particle” models reduce regulate the amount of dark matter through 3-to-2 interactions that reduce the total number of dark matter particles rather than annihilation into ordinary matter.

The authors of 1512.04545 have proposed an intermediate road that interpolates between these two types of dark matter. The “elastically decoupling dark matter” (ELDER) scenario. ELDERs have both of the above interactions: they can annihilate pairwise into ordinary matter, or sets of three ELDERs can turn into two ELDERS.

ELDER scenario
Thermal history of ELDERs, adapted from 1512.04545.

The cosmic history of these ELDERs is as follows:

  1. ELDERs are produced in thermal bath immediately after the big bang.
  2. Pairs of ELDERS annihilate into ordinary matter. Like WIMPs, they interact weakly with ordinary matter.
  3. As the universe expands, the rate for annihilation into Standard Model particles falls below the rate at which the universe expands
  4. Assuming that the ELDERs interact strongly amongst themselves, the 3-to-2 number-changing process still occurs. Because this process distributes the energy of 3 ELDERs in the initial state to 2 ELDERs in the final state, the two outgoing ELDERs have more kinetic energy: they’re hotter. This turns out to largely counteract the effect of the expansion of the universe.

The neat effect here is the abundance of ELDERs is actually set by the interaction with ordinary matter, like WIMPs. However, because they have this 3-to-2 heating period, they are able to produce the observed present-day dark matter density for very different choices of interactions. In this sense, the authors show that this framework opens up a new “phase diagram” in the space of dark matter theories:

A "phase diagram" of dark matter models. The vertical axis represents the dark matter self-coupling strength while the horizontal axis represents the coupling to ordinary matter.
A “phase diagram” of dark matter models. The vertical axis represents the dark matter self-coupling strength while the horizontal axis represents the coupling to ordinary matter.

Background reading on dark matter:

QCD, CP, PQ, and the Axion

Figure 1: Axions– exciting new elementary particles, or a detergent? (credit to The Big Blog Theory, [5])

Before we dig into all the physics behind these acronyms (beyond SM physics! dark matter!), let’s start by breaking down the title.

QCD, or quantum chromodynamics, is the study of how quarks and gluons interact. CP is the combined operation of charge-parity; it swaps a particle for its antiparticle, then switches left and right. CP symmetry states that applying both operators should leave the laws of physics invariant, which is true for electromagnetism. Interestingly it is violated by the weak force (this becomes the problem of matter-antimatter asymmetry [1]). But more importantly, the strong force maintains CP symmetry. In fact, that’s exactly the problem.

CP violation in QCD would give an electric dipole moment to the neutron. Experimentally, physicists have constrained this value pretty tightly around zero. But our QCD Lagrangian has a more complicated vacuum than first thought, giving it a term (Figure 2) with a phase parameter that would break CP [2]. Basically, our issue is that the theory predicts some degree of CP violation, but experimentally we just don’t see it. This is known as the strong CP problem.

Figure 2: QCD Lagrangian term allowing for CP violation. Current experimental constraints place θeff ≤ 10^−10 .

Naturally physicists want to find a fix for this problem, bringing us to the rest of the article title. The most recognized solution is the Peccei-Quinn, or PQ theory. The idea is that the phase parameter is not a constant but actually another symmetry of the Standard Model. This symmetry, called U(1)_PQ, is spontaneously broken, meaning that all states of the theory share the symmetry except for the ground state.

This may sound a bit similar to the Higgs mechanism, because it is. In both cases, we get a non-zero vacuum expectation value and an extra massless boson, called a Goldstone boson. However, as with the Higgs mechanism, the new boson is not exactly massless. Very few things are exact in physics, and approximate symmetry breaking means our massless Goldstone boson gains a tiny bit of mass after all. This new particle created from PQ theory is called an axion. This new axion effectively steps into the role of the phase parameter, allowing its value to relax to 0.

Is it reasonable to imagine some extra massive Standard Model particle bouncing around that we haven’t detected yet? Sure. Perhaps the axion is so heavy that we haven’t yet probed the necessary energy range at the LHC. Or maybe it interacts so rarely that we’ve been looking in the right places and just haven’t had the statistics. But any undiscovered massive particle floating around should make you think about dark matter. In fact, the axion is one of the few remaining viable candidates for DM, and lots of people are looking pretty hard for it.

One of the largest collaborations is ADMX at the University of Washington, which uses an RF cavity in a superconducting magnet to detect the very rare conversion of a DM axion into a microwave photon [3]. In order to be a good dark matter candidate, the axion would have to be fairly small, and some theories place its mass below 1 eV (for reference, the neutrinos are of mass ~0.3 eV). ADMX has eliminated possible masses on the micro-eV order. However, theorists are clever, and there’s a lot of model tuning available that can pin the axion mass practically anywhere you want it to be.

Now is the time to factor in the recent buzz about a diphoton excess at 750 GeV (see the January 2016 ParticleBites post to catch up on this.) Recent papers are trying to place the axion at this mass, since that resonance is yet to be explained by Standard Model processes.

Figure 3: Plot of data for recent diphoton excess observed at the LHC.

For example, one can consider aligned QCD axion models, in which there are multiple axions with decay constants around the weak scale, in line with the dark matter relic abundance [4]. The models can get pretty diverse from here, suffice it to say that there are many possibilities. Though this excess is still far from confirmed, it is always exciting to speculate about what we don’t know and how we can figure it out. Because of strong CP and these recent model developments, the axion has earned a place pretty high up on this speculation list.


References

  1. The Mystery of CP Violation, Gabriella Sciola, MIT
  2. TASI Lectures on the Strong CP Problem
  3. Axion Dark Matter Experiment (ADMX)
  4. Quality of the Peccei-Quinn symmetry in the Aligned QCD Axion and Cosmological Implications, arXiv: 1603.0209 [hep-ph].
  5. The Big Blog Theory on axions


LIGO and Gravitational Waves: A Hep-ex perspective

The exciting Twitter rumors have been confirmed! On Thursday, LIGO finally announced the first direct observation of gravitational waves, a prediction 100 years in the making. The media storm has been insane, with physicists referring to the discovery as “more significant than the discovery of the Higgs boson… the biggest scientific breakthrough of the century.” Watching Thursday’s press conference from CERN, it was hard not to make comparisons between the discovery of the Higgs and LIGO’s announcement.


The gravitational-wave event GW150914 observed by the LIGO Collaboration


Long standing Searches for well known phenomena


The Higgs boson was billed as the last piece of the Standard Model puzzle. The existence of the Higgs was predicted in the 1960s in order to explain the mass of vector bosons of the Standard Model, and avoid non-unitary amplitudes in W boson scattering. Even if the Higgs didn’t exist, particle physicists expected new physics to come into play at the TeV Scale, and experiments at the LHC were designed to find it.


Similarly, gravitational waves were the last untested fundamental prediction of General Relativity. At first, physicists remained skeptical of the existence of gravitational waves, but the search began in earnest with Joseph Webber in the 1950s (Forbes). Indirect evidence of gravitational waves was demonstrated a few decades later. A binary system consisting of a pulsar and neutron star was observed to release energy over time, presumably in the form of gravitational waves. Using Webber’s method for inspiration, LIGO developed two detectors of unprecedented precision in order to finally make direct observation.


Unlike the Higgs, General Relativity makes clear predictions about the properties of gravitational waves. Waves should travel at the speed of light, have two polarizations, and interact weakly with matter. Scientists at LIGO were even searching for a very particular signal, described as a characteristic “chirp”. With the upgrade to the LIGO detectors, physicists were certain they’d be capable of observing gravitational waves. The only outstanding question was how often these observations would happen.


The search for the Higgs involved more uncertainties. The one parameter essential for describing the Higgs, its mass, is not predicted by the Standard Model. While previous collider experiments at LEP and Fermilab were able to set limits on the Higgs mass, the observed properties of the Higgs were ultimately unknown before the discovery. No one knew whether or not the Higgs would be a Standard Model Higgs, or part of a more complicated theory like Supersymmetry or technicolor.


Monumental scientific endeavors


Answering the most difficult questions posed by the universe isn’t easy, or cheap. In terms of cost, both LIGO and the LHC represent billion dollar investments. Including the most recent upgrade, LIGO cost a total $1.1 billion, and when it was originally approved in 1992, “it represented the biggest investment the NSF had ever made” according to France Córdova, NSF director. The discovery of the Higgs was estimated by Forbes to cost a total of $13 billion, a hefty price to be paid by CERN’s member and observer states. Even the electricity bill costs more than $200 million per year.


The large investment is necessitated by the sheer monstrosity of the experiments. LIGO consists of two identical detectors roughly 4 km long, built 3000 km apart. Because of it’s large size, LIGO is capable of measuring ripples in space 10000 times smaller than an atomic nucleus, the smallest scale ever measured by scientists (LIGO Fact Page). The size of the LIGO vacuum tubes is only surpassed by those at the LHC. At 27 km in circumference, the LHC is the single largest machine in the world, and the most powerful particle accelerator to date. It only took a handful of people to predict the existence of gravitational waves and the Higgs, but it took thousands of physicists and engineers to find them.


Life after Discovery


Even the language surrounding both announcements is strikingly similar. Rumors were circulating for months before the official press conferences, and the expectations from each respective community were very high. Both discoveries have been touted as the discoveries of the century, with many experts claiming that results would usher in a “new era” of particle physics or observational astronomy.


With a few years of hindsight, it is clear that the “new era” of particle physics has begun. Before Run I of the LHC, particle physicists knew they needed to search for the Higgs. Now that the Higgs has been discovered, there is much more uncertainty surrounding the field. The list of questions to try and answer is enormous. Physicists want to understand the source of the Dark Matter that makes up roughly 25% of the universe, from where neutrinos derive their mass, and how to quantize gravity. There are several ad hoc features of the Standard Model that merit additional explanation, and physicists are still searching for evidence of supersymmetry and grand unified theories. While the to-do list is long, and well understood, how to solve these problems is not. Measuring the properties of the Higgs does allow particle physicists to set limits on beyond the Standard Model Physics, but it’s unclear at which scale new physics will come into play, and there’s no real consensus about which experiments deserve the most support. For some in the field, this uncertainty can result in a great deal of anxiety and skepticism about the future. For others, the long to-do list is an absolutely thrilling call to action.


With regards to the LIGO experiment, the future is much more clear. LIGO has only published one event from 16 days of data taking. There is much more data already in the pipeline, and more interferometers like VIRGO and (e)LISA, planning to go online in the near future. Now that gravitational waves have been proven to exist, they can be used to observe the universe in a whole new way. The first event already contains an interesting surprise. LIGO has observed two inspriraling black holes of 36 and 29 solar masses, merging into a final black hole of 62 solar masses. The data thus confirmed the existence of heavy stellar black holes, with masses more than 25 times greater than the sun, and that binary black hole systems form in nature (Atrophysical Journal). When VIRGO comes online, it will be possible to triangulate the source of these gravitational waves as well. LIGO’s job is to watch, and see what other secrets the universe has in store.

A New Particle at LHC for Christmas??

Hello particle gobblers and happy new year from my new location at the University of Granada.

In between presents and feasting, you may have heard rumblings over the holidays that the LHC could be seeing hints of a new and very massive particle. The rumors began even before the ATLAS and CMS experiments announced results from analyzing the brand new 13 TeV (in particle physics units!) data which was collected in 2015. At 13 TeV we are now probing higher energy scales of nature than ever before. These are truly uncharted waters where high energy physicists basically have no idea what to expect. So there was a lot of anticipation for the first release of new data from the LHC in early December and it appears a tantalizing hint of new physics may have been left there dangling for us, like a just out of reach Christmas cookie.

Since the announcement, a feeding frenzy of theoretical work has ensued as theorists, drunk from the possibilities of new physics and too much holiday food, race to put forth their favorite (or any) explanation (including yours truly I must confess:/). The reason for such excitement is an apparent excess seen by both CMS and ATLAS of events in which two very energetic photons (particles of light) are observed in tandem. By `excess’ I basically mean a `bump‘ on what should be a `smooth‘ background exactly as discussed previously for the Higgs boson at 125 GeV. This can be seen in the CMS (Figure 1) and ATLAS (Figure 2) results for the observed number of events involving pairs of photons versus the sum of their energies.

Figure 1: CMS results for searches of pairs of photons at 13 TeV.
Figure 2: ATLAS results for searches of pairs of photons at 13 TeV.


The bump in the ATLAS plot is easier to see (and not coincidentally has a higher statistical significance) than the CMS bump which is somewhat smaller. What has physicists excited is that these bumps appear to be at the same place at around 750 GeV^1. This means two independent data sets both show (small) excesses in the same location making it less likely to be simply a statistical fluctuation. Conservation of energy and momentum tells us that the bump should correspond to the mass of a new particle decaying to two photons. At 750 GeV this mass would be much higher than the mass of the heaviest known particle in the Standard Model; the top quark, which is around 174 GeV while the Higgs boson you will remember is about 125 GeV.

It is of course statistically very possible (some might say probable) that these are just random fluctuations of the data conspiring to torture us over the holidays. Should the excess persist and grow however, this would be the first clear sign of physics beyond the Standard Model and the implications would be both staggering and overwhelming. Simply put, the number of possibilities of what it could be are countless as evidenced by the downpour of papers which came out just in the past two weeks and still coming out daily.

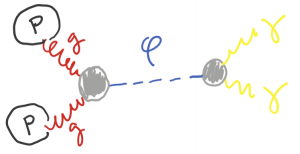
A simple and generic explanation which has been proposed by many theorists is that the excess indicates the presence of a new, electrically neutral, spin-0 scalar boson (call it \varphi) which is produced from the fusion of two gluons and which then decays to two photons (see Figure 3) very much like our earlier discussion of the Higgs boson. So at first appearance this just looks like a heavy version of the Higgs boson discovered at 125 GeV. Crucially however, the new potential scalar at 750 GeV has nothing (or atleast very little) to do with generating mass for the W and Z bosons of the Standard Model which is the role of the Higgs boson. I will save details about the many possibilities for a future post^2, but essentially the many models put forth attempt to explain what occurs inside the gray `blobs’ in order to generate an interaction between \varphi with gluons and photons.

Figure 3: Production of a new scalar particle via gluon fusion followed by decay into photons.

It will of course take more data to confirm or deny the excess and the possible existence of a new particle. Furthermore, if the excess is real and there is indeed a new scalar particle at 750 GeV, a host of other new signals are expected in the near future. As more data is collected in the next year the answers to these questions will begin to emerge. In the meantime, theorists will daydream of the possibilities hoping that this holiday gift was not just a sick joke perpetrated by Santa.

Footnotes:

1. It is a bit difficult to tell by eye because the ATLAS plot axis is linear while that for CMS is logarithmic. A nice discussion of the two bumps and their location can be found here.

2. For those feeling more brave, a great discussion about the excess and its implications can be found here and here.