Saving SUSY: Interpreting the 3.3σ ATLAS Stop Excess

Article: Surviving scenario of stop decays for ATLAS l+jets+E_T^miss search
Authors: Chengcheng Han, Mihoko M. Nojiri, Michihisa Takeuchi, and Tsutomu T. Yanagida
Reference: arXiv:1609.09303v1 [hep-ph]

If you’ve been following the ongoing SUSY searches, you know that much of the phase space accessible at colliders like the LHC has been ruled out. Nevertheless, many phenomenologists are working diligently to develop alternative frameworks that maintain the compatibility of the Minimal Supersymmetric Standard Model (MSSM, one of the most compelling SUSY models) with recent experimental results. If evidence of SUSY is found at the LHC, it could help us start answering questions about naturalness, dark matter, gauge coupling unification, and other BSM questions, so it’s no wonder so many researchers are invested in keeping the SUSY search alive.

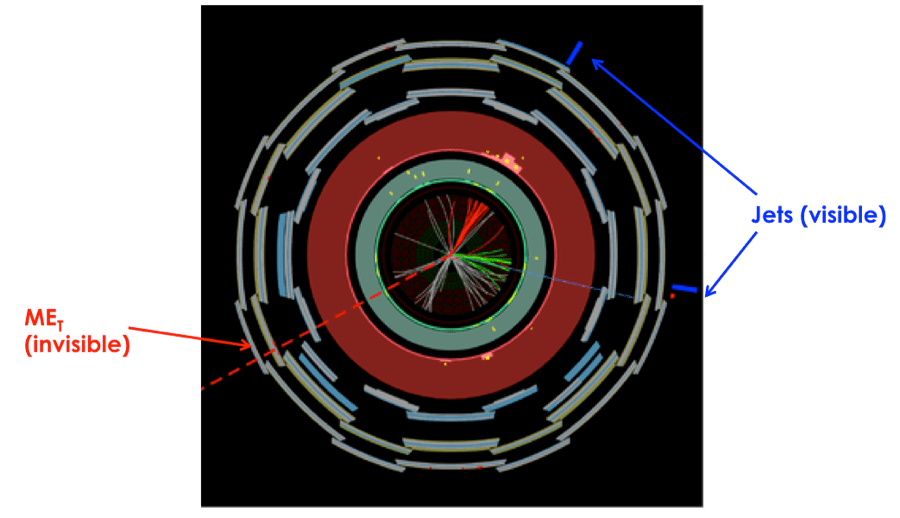
This particular paper discusses recent 13 TeV ATLAS results in the l+jets+ETmiss channel where an excess of up to 3.3σ above Standard Model expectations were seen in the initial 13TeV Run 2 dataset. Although CMS hasn’t reported any significant excess in this channel, both experiments see a moderate excess in the 0 lepton channel, so there’s some strong motivation for phenomenologists to explain these preliminary results as the presence of a new particle, namely a SUSY particle.

This ATLAS search is aimed at stop (the SUSY partner of the top quark) production where the stop then decays into a top and neutralino (a mixed state of the higgsino and gaugino, ie the SUSY partners of the Higgs and the gauge boson), and the top then decays to leptons. The stop is a particularly interesting SUSY particle, because it plays a critical role in the naturalness of SUSY models; most natural SUSY models predict a light stop and higgsino. The analysis group defined 7 (non exclusive) potential signal regions for this search, and excesses above 2σ were seen in 3 of them: DM_low, bC2x_diag, and SR1. The selection cuts for these regions are shown in Table 1. This paper discussed models to explain the DM_low excess of 3.3σ, but similar models could be used to explain the other excesses as well. The authors sought to create models which are compatible both with these results and the previous stop parameter limits set by ATLAS and CMS.

Table 1: Summary of the selection cuts for the 7 signal regions considered in this search

They first explored the two simplest one-step stop decays. Depending on what the Lightest Supersymmetric Particle (LSP) is, these decays can have different constraints, so they conducted a scan over the entire parameter space. There are two cases for this type of decay: (1) the LSP is a bino (SUSY partner of weak hypercharge boson) and the Next Lightest Super Symmetric Particle (NLSP) is the stop,leading to the simple decay shown in Figure 1a, or (2) the LSP is a higgsino which can be charged or neutral, with each possibility having different masses, which leads to the split decay shown in Figure 1b.

Figure 1: Decay diagrams for the Bino LSP scenario (left) and Higgsino LSP scenario (right)

We can see in Figure 2 that most (or all in the case of the higgsino) of the preferred 2σ phase-space for these models are ruled out by existing constraints on stop production, so unfortunately these models aren’t particularly promising. Consequently, the authors designed an additional model essentially combing these two processes, where the LSP is a bino and the NLSP is a higgsino. This allows for both one step and two step decays, as shown in Figure 3. The results for this model are much more exciting; almost all of the preferred 2σ phase space exists outside of the existing constraints, as shown in Figure 4!

Figure 2: 2 sigma preferred region and exclusion limits from experiments for Bino LSP (left) and Higgsino LSP (right)

Screen Shot 2016-10-11 at 1.10.58 PM


2 additional references are included in the Figure 4 plot. 3 benchmark models for different combinations of higgsino and stop masses are indicated with red crosses, and all of them fall in this allowed phase space. Furthermore, direct dark matter detection limits from the LUX experiment are shown as a dashed black line. The left side of this line has been excluded by LUX, so one of the considered benchmark models is not allowed. The second benchmark model falls near the exclusion line, so upcoming dark matter results will play an important role in telling us if this SUSY model can actually explain the excess!

Figure 3: Decay diagram for the Bino LSP, Higgsino NLSP scenario
Figure 4: 2 sigma preferred region and exclusion limits for the Bino LSP and Higgsino NLSP model with benchmark points and LUX exclusion limit

So, SUSY hasn’t been found at the LHC, but its not dead yet! There are promising excesses in the current ATLAS dataset which are consistent with benchmark MSSM models with expected LSP candidates. We look forward to new data from the LHC and other experiments to tell us more!

References and further reading:

  • Stephen P. Martin, “Supersymmetry primer” (arXiv:hep-ph/9709356)
  • Sven Krippendorf, Fernando Quevedo, Oliver Schlotterer, “Cambridge Lectures on Supersymmetry and Extra Dimensions” (arXiv:1011.1491)
  • John Ellis, “Supersymmetry, Dark Matter, and the LHC” (slides)


What Happens When Energy Goes Missing?

Title: “Performance of algorithms that reconstruct missing transverse momentum in s = √8 TeV proton–proton collisions in the ATLAS detector”
Authors: ATLAS Collaboration

Reference: arXiv:1609.09324

Check out the public version of this post on the official ATLAS blog here!


The ATLAS experiment recently released a note detailing the nature and performance of algorithms designed to calculate what is perhaps the most difficult quantity in any LHC event: missing transverse energy. Missing energy is difficult because by its very nature, it is missing, thus making it unobservable in the detector. So where does this missing energy come from, and why do we even need it?

Figure 1

The LHC accelerate protons towards one another on the same axis, so they will collide head on. Therefore, the incoming partons have net momentum along the direction of the beamline, but no net momentum in the transverse direction (see Figure 1). MET is then defined as the negative vectorial sum (in the transverse plane) of all recorded particles. Any nonzero MET indicates a particle that escaped the detector. This escaping particle could be a regular Standard Model neutrino, or something much more exotic, such as the lightest supersymmetric particle or a dark matter candidate.

Figure 2

Figure 2 shows an event display where the calculated MET balances the visible objects in the detector. In this case, these visible objects are jets, but they could also be muons, photons, electrons, or taus. This constitutes the “hard term” in the MET calculation. Often there are also contributions of energy in the detector that are not associated to a particular physics object, but may still be necessary to get an accurate measurement of MET. This momenta is known as the “soft term”.

In the course of looking at all the energy in the detector for a given event, inevitably some pileup will sneak in. The pileup could be contributions from additional proton-proton collisions in the same bunch crossing, or from scattering of protons upstream of the interaction point. Either way, the MET reconstruction algorithms have to take this into account. Adding up energy from pileup could lead to more MET than was actually in the collision, which could mean the difference between an observation of dark matter and just another Standard Model event.

One of the ways to suppress pile up is to use a quantity called jet vertex fraction (JVF), which uses the additional information of tracks associated to jets. If the tracks do not point back to the initial hard scatter, they can be tagged as pileup and not included in the calculation. This is the idea behind the Track Soft Term (TST) algorithm. Another way to remove pileup is to estimate the average energy density in the detector due to pileup using event-by-event measurements, then subtracting this baseline energy. This is used in the Extrapolated Jet Area with Filter, or EJAF algorithm.

Once these algorithms are designed, they are tested in two different types of events. One of these is in W to lepton + neutrino decay signatures. These events should all have some amount of real missing energy from the neutrino, so they can easily reveal how well the reconstruction is working. The second group is Z boson to two lepton events. These events should not have any real missing energy (no neutrinos), so with these events, it is possible to see if and how the algorithm reconstructs fake missing energy. Fake MET often comes from miscalibration or mismeasurement of physics objects in the detector. Figures 3 and 4 show the calorimeter soft MET distributions in these two samples; here it is easy to see the shape difference between real and fake missing energy.

Figure 3: Distribution of the sum of missing energy in the calorimeter soft term shown in Z to μμ data and Monte Carlo events.


Figure 4: Distribution of the sum of missing energy in the calorimeter soft term shown in W to eν data and Monte Carlo events.

This note evaluates the performance of these algorithms in 8 TeV proton proton collision data collected in 2012. Perhaps the most important metric in MET reconstruction performance is the resolution, since this tells you how well you know your MET value. Intuitively, the resolution depends on detector resolution of the objects that went into the calculation, and because of pile up, it gets worse as the number of vertices gets larger. The resolution is technically defined as the RMS of the combined distribution of MET in the x and y directions, covering the full transverse plane of the detector. Figure 5 shows the resolution as a function of the number of vertices in Z to μμ data for several reconstruction algorithms. Here you can see that the TST algorithm has a very small dependence on the number of vertices, implying a good stability of the resolution with pileup.

Figure 5: Distribution of the sum of missing energy in the calorimeter soft term shown in W to eν data and Monte Carlo events.

Another important quantity to measure is the angular resolution, which is important in the reconstruction of kinematic variables such as the transverse mass of the W. It can be measured in W to μν simulation by comparing the direction of the MET, as reconstructed by the algorithm, to the direction of the true MET. The resolution is then defined as the RMS of the distribution of the phi difference between these two vectors. Figure 6 shows the angular resolution of the same five algorithms as a function of the true missing transverse energy. Note the feature between 40 and 60 GeV, where there is a transition region into events with high pT calibrated jets. Again, the TST algorithm has the best angular resolution for this topology across the entire range of true missing energy.

Figure 6: Resolution of ΔΦ(reco MET, true MET) for 0 jet W to μν Monte Carlo.

As the High Luminosity LHC looms larger and larger, the issue of MET reconstruction will become a hot topic in the ATLAS collaboration. In particular, the HLLHC will be a very high pile up environment, and many new pile up subtraction studies are underway. Additionally, there is no lack of exciting theories predicting new particles in Run 3 that are invisible to the detector. As long as these hypothetical invisible particles are being discussed, the MET teams will be working hard to catch them.


Tracking the Jets to Monte Carlo

Article: Calculating Track-Based Observables for the LHC
Authors: Hsi-Ming Chang, Massimiliano Procura, Jesse Thaler, and Wouter J. Waalewijn
Reference: arXiv:1303.6637 [hep-ph]

With the LHC churning out hordes of data by the picosecond, theorists often have to work closely with experimentalists to test various theories, devise models, etc. In order to make sure they’re developing the right kinds of tools to test their ideas, theorists have to understand how experimentalists analyze their data.

One very simple example that’s relevant to the LHC involves the reconstruction of jets. Experimentalists often reconstruct jets from only the charged particles (such as \pi^{\pm}) they see in the detector while theorists generally do calculations where jets have both charged and neutral particles (such as \pi^0, see my previous ParticleBites for a more general intro to jets). In order to compare predictions with experiment, someone is going to have to compromise. The concept of Track-Based Observables is an interesting example of a way of attacking the more general problem of connecting the blackboard with accelerator.

Before diving into the details, let’s briefly look at the basics of how theorists and experimentalists make predictions about these trouble-making collimated sprays of radiation.

Figure 1: A basic diagram of different parts of the ATLAS detector. Note, in particular, what's being measured at the calorimetry and tracking stages.
Figure 1: A basic diagram of different parts of the ATLAS detector. Note, in particular, what’s being measured at the calorimetry and tracking stages.

Experiment: For experimentalists, jets are collections of clustered signatures left on the detector. These signatures generally come from calorimetry (i.e. measure the energy deposits) and/or from tracking where the trajectories (i.e. the kinematics) of final state particles are measured. At the LHC, where luminosities are absurdly high, a phenomenon known as “pileup” becomes an increasingly aggravating contaminant in the data. In short, pile-up is caused by the fact that the LHC isn’t just shooting a single proton at another proton in the beam, its shooting bunches of protons at each other. Of course while this makes the likelihood of a direct proton-proton collision more likely, it also causes confusion when looking at the mess of final state particles. How do you know which tracks of particles came from a given collision? It turns out that since measuring particle tracks gives you the kinematic properties of particles, those particles are much easier to deal with. However, neutral particles aren’t detected via tracking at the LHC, only via calorimetry. Thus, to make their lives significantly easier, experimentalists can simply do their analyses and reconstruct jets using purely the charged particles.

Theory: The notion of ignoring charged particles in the name of convenience doesn’t immediately jive with theorists. When using standard Quantum Field Theoretic (QFT) techniques to make predictions about jets, theorists have to turn back the clock on the zoo of final state particles that experimentalists analyze. For most sane theorists, calculations that involve 1 particle splitting into 2 is about all we generally tackle using perturbative QFT. Depending on the circumstances, calculating things at this stage is usually said to be a “next-to-leading order” or NLO calculation when one is using perturbation theory to describe strong interactions. This is because there is a factor of the strong coupling constant \alpha_s multiplying this piece of whatever expression you’re dealing with. Luckily, it turns out that in QCD, this is largely all you need most of the time to make decent predictions. The tricky part is then turning a prediction about 1 particle splitting into 2 into a prediction about those particles splitting into 4 then 8 and so on, i.e. a fully hadronized and realistic event. For this, theorists generally employ hadronization “models” that are found by fitting to data or events simulated by Monte Carlo event generators. But how do you do this fitting? How can you properly separate physics into non-perturbative and perturbative pieces in a way that makes sense?

Figure 1: Theorists have to take parton-level predictions that can be reasonably calculated analytically using perturbative-QCD (or an effective theory) and using a combination of tools, turn these calculations into predictions about fully hadronized events. This diagram shows an example of a single parton hadronizing into many final state particles. The 1->2 splitting is calculated in perturbation theory. The second stage, which involves various q->qg, g->gg, etc. splittings (often referred to as "showering") is often obtained using something called "renormalization group evolution" which is beyond the scope of this bite. The final stage involves the actual fragmentation of partons into hadrons. This is where non-perturbative physics takes over and fits must often be done to Monte Carlo event generators or data. This diagram can be found in a fantastic talk by one of the paper's authors at https://goo.gl/2QlkSz.
Figure 2: Theorists have to take parton-level predictions that can be reasonably calculated analytically using perturbative-QCD (or an effective theory) and using a combination of tools, turn these calculations into predictions about fully hadronized events. This diagram shows an example of a single parton hadronizing into many final state particles. The 1->2 splitting is calculated in perturbation theory. The second stage, which involves various q->qg, g->gg, etc. splittings (often referred to as “showering”) is often obtained using something called “renormalization group evolution” which is beyond the scope of this bite. The final stage involves the actual fragmentation of partons into hadrons. This is where non-perturbative physics takes over and fits must often be done to Monte Carlo event generators or data. This diagram can be found in a fantastic talk by one of the paper’s authors at BOOST 2013.

The popular way of handling the tricky task of connecting NLO calculations with fully hadronized events is by using factorization theorems. What factorization theorems do, in short, is to compartmentalize analytic calculations into pieces involving physics happening at widely separated energy scales. Using perturbative techniques, we calculate relevant processes happening in each regime separately, and then combine those pieces as dictated by the factorization theorem to come up with a full answer. This oftentimes involves splitting up an observable into a perturbatively calculable piece and a non-perturbative piece that must be obtained via a fit to data or a Monte Carlo simulation.

Warning: These theorems are, in all but a few cases, not rigorously defined although there are many examples where factorization theorems can be shown to be true up to small power corrections in some parameter. This is often where the power of effective field theories is used. We’ll address this important and complex issue in future bites.
Where do track-based observables fit into all of this? Once we have a factorization theorem, we have to make sure that we encapsulate the physics in a systematic way that doesn’t have infinities popping up all over the place (as often happens when theorists aren’t careful). The authors of arXiv:1303.6637 define track functions that are combined with perturbatively calculable pieces via a factorization theorem they discuss to make an observable cross-section. To find the track functions, they fit their NLO analytic distributions for the fraction of the total jet energy carried by the jet’s charged particles to simulations done by PYTHIA.

Figure 3: The authors plot their analytic calculations combined with fitted track functions against results generated entirely from PYTHIA. Their results show that track functions can do a good job (up to smearing effects that PYTHIA's hadronization model imposes).
Figure 3: The authors plot their analytic calculations combined with fitted track functions against results generated entirely from PYTHIA. Their results show that track functions can do a good job (up to smearing effects that PYTHIA’s hadronization model imposes).

As can be seen in Figure 2, the authors then make predictions for a totally different observable using track functions combined with their analytic calculations and compare them to events generated entirely in PYTHIA, achieving very good results. Let’s take a second to appreciate how powerful an idea this is. By writing down the foundation for track functions, the authors have laid the groundwork for a host of track-based observables that focus specifically on probing the charged particles within a jet. However, the real impact is that these track functions are that they can be applied to any quarks/gluons that are undergoing fragmentation in any process. When these are eventually extracted from data at the LHC, phenomenologists will be able to perform analytic calculations and then, using track functions, make precision predictions about track-based observables that experimentalists can then use to more easily extract information about the structure of jets.

Further Reading

  1. “Fragmentation and Hadronization,” by B.R. Webber of Cambridge/CERN. A concise and very clear introduction to the basics of how we model non-perturbative physics and the basic ideas behind how Monte Carlo event generators simulate fragmentation/hadronization.
  2. “Factorization of Hard Processes in QCD”, by Collins, Soper, and Sterman. The grandaddy of papers on factorization by 3 giants in the field. Outlines the few existing proofs of factorization theorems.
  3. “How a detector works,” A quick and very basic introduction to detectors used in particle physics.

Does the Higgs talk to itself?

Article: Indirect probes of the trilinear Higgs Coupling
Authors: Martin Gorbahn, Ulrich Haisch
Reference: 1607.03773

Hello particle munchers,

I’m back to further discuss our good friend the Higgs boson.

After its discovery in 2012, there are many properties of the Higgs boson which have since been established. In addition to its spin-0 nature and measuring its mass with high precision (125 GeV), the existence of its couplings to a number of Standard Model particles has also been established.

What has yet to be established is whether the Higgs can “talk to itself”. More precisely, does the Higgs have self interactions involving multiple Higgs bosons (see diagrams in Figure 1) and how strong are these self interactions? Measuring these interactions gives us direct information on the Higgs scalar potential, which is responsible for not only the electroweak symmetry breaking mechanism leading to the generation of mass for the Standard Model particles, but also has implications for the stability of our universe (see Footnote 1) .

The Higgs potential can be written in a very simple form (just a polynomial in the Higgs field H) as shown in Figure 1. The H^2 term represents the Higgs mass while the H^3 and H^4 terms represent the Higgs self interactions we are interested in. In the Standard Model \lambda_3 and \lambda_4 have a precise relation reflecting the underlying symmetries of the SM. By measuring interactions involving 3 and 4 Higgs bosons we can determine these parameters and therefore test directly this prediction of the SM. A deviation from from the Standard Model prediction would signal the presence of new physics which, needless to say, would send theorist into a drunk frenzy not seen since…oh wait, never mind :/.

Figure 1: V(H) represents the Higgs potential. We have also indicated which terms in the potential correspond to interactions between 3 and 4 Higgs bosons.

Typically one attempts to measure \lambda_3 and \lambda_4 using h \to hh and h\to hhh decays respectively (see Footnote 2). The h\to hhh rate is far too small at the LHC to be useful for extracting \lambda_4. Thus, most theoretical and experimental studies (see here and references therein) have focused on measuring \lambda_3 via h\to hh decays.

Since the h\to hh rate is also small, it requires producing many Higgs bosons so that after a long time and massive amounts of data, enough of them will decay off-shell into pairs of Higgs bosons to be seen at colliders. At LHC energies the production rates are not quite large enough to be able see this process if it conforms to the SM prediction. However, if new physics somehow makes the rate much larger than found in the SM, then perhaps it can be seen at the LHC.

The paper highlighted above is interesting because it proposes a new, but indirect, way to measure \lambda_3 at the LHC by looking at gluon fusion Higgs production and h\to \gamma\gamma decays (where \gamma is a photon), which i’ll focus on in todays post. If you recall my earlier post about how we see the Higgs boson in its decays to pairs of photons, you might remember that the interaction between the Higgs and photons is generated through loops of virtual charged particles. At leading one loop order, there can only be charged particles running in the loop and thus no Higgs bosons. This means that at leading order we are not sensitive to \lambda_3. However, if we go to next to leading order at two loops one can have Higgs bosons contribute as shown in Figure 2. In this case we see the Higgs boson can enter in the loops and in particular the \lambda_3 coupling at the vertex with 3 Higgs bosons indicated by the box.

Figure 2: Two loop contributions to Higgs decays to pairs of photons. The box indicates the Higgs self interaction we are interested in.
Figure 2: Two loop contributions to Higgs decays to pairs of photons. The box indicates the Higgs self interaction we are interested in (figure from arxiv: 1607.03773).

Since these two loop processes are next to leading order, they are in general very small. However, the high precision with which h\to \gamma\gamma will eventually be measured at the LHC allows for these tiny effects to be potentially probed. What is interesting is that the authors find that these indirect methods are competitive and complementary to h\to hh decays at the LHC. They find it will be possible to eliminate regions of parameter space in beyond the Standard Model theories which can not be ruled out with the more conventional and direct h\to hh decays.

Though the precision is still not great, due to the importance of establishing the precise form of the Higgs potential, it is crucial to have as many ways as possible of constraining its parameters. Since the LHC will just begin to probe the parameters of the Higgs potential before the end of running, a future collider which could produce far larger numbers of Higgs bosons will be crucial in this endeavor of determining if indeed the Higgs talks to itself.

Footnotes

  1. I’ll discuss this interesting topic of the vacuum stability of the universe more in a future post, but see here for a great discussion or here for a famous paper about it. Or just ask Stephen Hawking.
  2. You might ask how one Higgs boson can decay to multiple Higgs bosons when clearly one Higgs boson has less mass than two or more Higgs bosons. This of course is due to the subtleties of quantum mechanics which leads to the fact that particles can decay `off mass shell’ (more precisely with a 4-momentum squared which is not equal to its physical mass). This means that particles which naively are too light to decay to a particular more massive final state can still do so at the cost of a massive kinematic suppression.

Further reading: 

  1. Very similar study proposing additional indirect probes of \lambda_3
  2. A basic introduction to the physics of the Standard Model Higgs boson

Universality classes are not that universal (…and some of its other shortcomings)

Article: Shortcomings of New Parameterizations of Inflation
Authors: J. Martin, C. Ringeval and V. Vennin
Reference: arXiv:1609.04739

The Cosmic Microwave Background radiation (CMB) is an amazingly simple and beautiful picture that is pivotal for observational cosmology. It is the oldest light in our Universe: it originates from when the Universe was only a sprightly 380,000 years old, much younger than its current 13.8 billion years. Cosmologists can measure this radiation to high precision and extract information about the early Universe. Specifically, they can learn about the epoch of inflation, which was a period of accelerated expansion in the first fractions of a second after the Big Bang.

There are hundreds of theoretical inflationary models that attempt to describe the physics of this epoch. All of them have slightly different predictions for the two important numbers, \displaystyle n_s and r. The number n_s measures the relative strength of cosmological perturbations with different wavelengths: if it is exactly equal to one, all perturbations have the same power, if it is smaller than one, the longer wavelengths have more power and if it is bigger than one, the smaller wavelengths have more power. r is, loosely speaking, the ratio of primordial gravitational waves to the other primordial cosmological fluctuations. In other words, it measures how many gravitational waves were produced in the early universe as compared to what was around at that time.

fromcmbtoinflationfigure

Recent data from the  Planck satellite have ruled out many models on the basis of these numbers, but a large class of scenarios remains compatible with the data. The hope is that future experiments will further restrict the number of allowed models to help us pinpoint what actually happened during inflation. One way to go about determining what the “correct” model of inflation is, is to systematically compare the predictions of each model with the data. However, a more efficient method is to have a model-independent parametrization of inflation so that you don’t have to specify your model, i.e. the particles and interactions, and then compute the values for n_s and r every time you change the model.  There exist several of these model-independent descriptions of inflation: the truncated horizon-flow formalism, the hydrodynamical description of inflation and “universality classes” . The authors of this article argue that each of these approaches has serious shortcomings. Here I summarize the main drawbacks of the “universality classes”.


So what are universality classes? One can write n_s and r as a function of how much our universe expanded during the final phase of inflation, \Delta N_* . \Delta N_* is typically taken to be large, and thus 1 / \Delta N_* is small. Therefore, the expressions for n_s and r can be expanded in terms of the smallness parameter 1 / \Delta N_*. Then it turns out that the leading order behavior falls into three classes:

  1. Perturbative, for which the leading order term shows power-law behavior;
  2. Non-perturbative, for which the leading order term is an exponential;
  3. Logarithmic, for which the leading order term is logarithmic in \Delta N_*.

When all these classes were introduced, the idea was that they allow a model-independent, systematic way to analyze the data. But we shall see that there are some issues with this approach.


First of all, it turns out that the three universality classes are not enough to describe all inflationary models. At leading order in the 1/\Delta N_* expansion, a given model may fall into one of these classes, but at the next-to-leading order it can belong to a different class. For instance, consider the popular inflationary model called Starobinsky inflation. Starobinsky inflation is non-perturbative at leading order but logarithmic at the next. Thus, the three classes are not enough to classify all models and you need to increase the number of classes if you consider the next-to-leading order. This is not a problem by itself, but it this means that one of the attractive features of these universality classes (“you only need three classes”) is not true. Due to these higher order terms, you need to introduce new hybrid classes. The number of universality classes increases even more if you go to even higher orders. Now you may argue that this is only a theoretical issue and that the lowest order is more than enough to describe the data. But this is not the case, as you can see in Fig.1.: you need at least to go to the next order to get accurate predictions (especially for future CMB experiments).


sfi4_nslogr_eps-1
Figure 1: Predictions (circles) versus  1/\Delta N_* expansion (diamonds) in (n_s, r) plane for various values of \Delta N_* (color bar) for a specific model of inflation. The current one- and two-sigma confidence intervals from the Planck 2015 data are shown together with the forecasts of some future experiments such as LiteBird and LiteCore. For a fixed value of \Delta N_* , the 1/\Delta N_*  expansion is not sufficiently accurate.

Secondly, for many inflationary models if one were to apply the 1/\Delta N_* expansion, one finds that the terms in the expansion depend on the parameters of the specific inflationary model. This is, in principle okay, but it can happen that the 1/\Delta N_* expansion is only valid for a restrictive set of the parameter space. This can exclude the realistic values for the parameters of the model. So there are various inflationary scenarios for which one cannot even perform the 1/\Delta N_* expansion! Thus, the ‘universality classes’ are not as universal as the name suggests.

Third, the 1/\Delta N_* expansion is useful if you know a priori the allowed range of \Delta N_*. Typically, one assumes \Delta N_* \in \left[ 50,60 \right] (or if you are slightly more conservative \Delta N_* \in \left[ 40,70 \right]).  However,  these values are only reasonable under specific conditions and depend sensitively on the period of reheating that follows inflation and the scale of inflation. For instance, one can even have  \Delta N_* =100 in single-field inflation depending on the details of reheating. So for various models, \Delta N_* falls outside the typically chosen range. This questions the usefulness of the  1/\Delta N_* expansion given that one cannot  predict the value of  \Delta N_* accurately.

Finally, and this may be even the strongest drawback of this model independent approach: it is statistically flawed. If you look for example at the perturbative class and you want to fit the data to:

\epsilon = \beta (\Delta N_*)^{- \alpha}

then you need to give a statistical prior for \alpha and \beta. We may take a flat prior for these parameters. Now consider a particular model of inflation and reheating that falls within this universality class and is described by some parameters \theta_1, \theta_2, \ldots \theta_n. For this model, the parameters \alpha and \beta are functions of \theta_1, \theta_2, \ldots \theta_n and assuming a flat prior for \alpha and \beta may induce a very funky prior for the parameters of the inflationary model \theta_1, \theta_2, \ldots \theta_n. Thus, from a statistical approach these universality classes are not particularly useful either as the introduce very unnatural priors on the parameters in the inflationary models it tries to describe.


Further reading 

  • Beautiful lecture notes on early universe cosmology and inflation by Daniel Baumann are available on his website 
  • Another set of great lecture notes by another expert in the field, Leonardo Senator, is also a good introduction to inflation and the CMB
  • For more background on the universality classes, see the original articles referenced in the paper.